History of the study
In Germany in 1909, the physician-scientist Korbinian Brodmann first constructed and described maps of Brodmann's cytoarchitectonic fields. Ten years later, O. Vogt and C. Vogt studied and described more than a hundred myelo-architectonic areas in the cerebral hemispheres.
As a result, at the State Scientific Center for Neurology I.N. Filimonov and S.A. Sarkisov released a map of the brain hemispheres according to Brodmann, which describes 47 fields.
Brodmann fields are most often used in studying the neural organization of the brain and its functioning. The division of one or another area of the brain into a specific section of the fields was carried out on the basis of histological analysis - Nissl color staining.
A little about history
Many scientists were involved in constructing a map of the surface of the brain: Bailey, Betz, Economo and others. Their maps differed significantly from each other in the shape of the fields, their size, and number. In modern neuroanatomy, Brodmann's brain fields have received the greatest recognition. There are 52 fields in total.
Pavlov, in turn, divided all fields into two large groups:
- centers of the first signal system;
- centers of the second signaling system.
Each center consists of a core, which plays a key role in performing the function of a specific center, and analyzers surrounding the core. It is noteworthy that centers in the cerebral cortex regulate the functioning of organs on the opposite side of the body. This is due to the fact that the nerve fiber pathways cross on their way from the center to the periphery.
Brodmann's brain fields are designated by Arabic numerals, some also have a designation from which the function of a particular field can be understood.
Centers of the first signal system
The first signaling system is found both in Homo sapiens and in other living beings. It performs the functions of understanding and analyzing irritations emanating from the surrounding world and manifesting itself in the form of sensations and ideas.
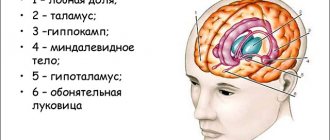
The centers of the first signaling system are located in the nuclei of sensory sensitivity analyzers, motor analyzers, auditory, skin, visual and olfactory analyzers.
They are indicated in the superior and inferior parietal regions of the brain, in the precentral and supramarginal sulcus, as well as in the thickness of the lateral sulcus (auditory nuclei).
The purpose of this system is presented in the table of Brodmann fields:
| Brodmann fields | Analyzer cores | Functions |
| 1, 2, 3, 5, 7 | Cortical | Responsible for the perception of temperature and pain, as well as tactile sensations. Affective pathways extending to the cerebral cortex intersect in the region of the spinal cord and medulla oblongata. Because of this, the functions of either hemisphere are controlled by the diametrically inverted part of the body. |
| 6 and 4 | Motor | Neurons are released here, the reactions from which control the muscles of the lower body and facial muscles. |
| 8 | Skulls and eyes | Nuclei that control head and eye movements. |
| 40 | Motor | They control the voluntary, purposeful movements of an animal or person. |
| 18, 17 and 19 | Visual | Responsible for visual memory, perception of images and orientation in unfamiliar places. |
| 7 | Skin | Performs tactile functions of recognizing objects and surfaces by touch and other types of skin sensitivity. |
| 41, 42 and 52 | Auditory | Perceiving and remembering sounds from the outside. |
| 43 | Olfactory | Phylogenetically the oldest region of the cerebral cortex. Provides the function of perception and memory of odors. Closely related to taste sensations. |
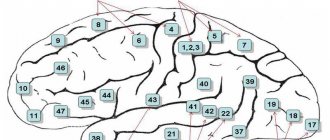
The picture shows the fields of the cerebral cortex according to Brodmann and their functions:
Groups of brain fields according to Brodmann
Description of Brodmann fields in the cerebral cortex by zone:
- The first zone is motor , responsible for reactions of active movements. This zone includes 4, 6, 8, 9 Brodmann fields. 4 is responsible for motor skills and is located in the precentral gyrus. 6 is allocated in the anterior regions of the precentral gyrus and in the area of the middle frontal gyrus. 8 coordinates voluntary eye movement and is located in the posterior parts of the superior and middle frontal gyri. 9 is located in the prefrontal region.
- The second zone is affective . Includes areas of the cerebral cortex posterior to the Rolandic fissure. Here are fields 1, 2, 3, 5 and 7. The upper part of the zone is responsible for tactile sensations of the legs and genitals. The underlying areas are for sensations in the hands, skull and mouth. The second zone directly interacts with the first. The first zone contains afferent nerve cells that receive stimuli from proprioceptors - these are motor sensory areas. The second zone contains motor components - these are sensorimotor areas that regulate the formation and intensity of pain sensations.
- The third zone is visual , located in the occipital region of the cerebral cortex. It includes 17, 18, 19 Brodmann fields. The 17th belongs to the primary visual area, and the 18th and 19th to the secondary visual area. From the secondary areas, visual stimuli come to the primary areas and are already processed there. With pathologies of the 17th Brodmann area, cortical blindness occurs - loss of visual perception. In case of violation of 18, the function of identification and perception of written speech is affected. In pathologies 19, hallucinations and disturbances in figurative memory are noted.
- The fourth zone is auditory , located in the temporal zone of the cerebral cortex. It includes 22, 41, 42, 52 fields. With damage to 22, auditory hallucinations are noted, orientation to sound is affected, and musical deafness occurs. With pathologies 42, sound recognition suffers, and lesion 41 causes cortical deafness, that is, a complete loss of auditory perception. 52 is a zone that is responsible for the spatial perception of voices, sounds and speech.
- The fifth, olfactory zone, includes fields 11 and 29, which are located in the pyriform gyrus. Responsible for recognizing different odors.
- The sixth zone is the taste zone , which includes the 43rd field.
- The seventh zone is speech , in right-handed people it is located in the left hemisphere. This includes field 22 - Wernicke's speech center, field 37 - controls voluntary speech and its understanding, field 47 - singing areas, 44 and 45 - Brocca's speech centers.
- fields 24, 25 and 26 perform the task of recognizing mismatches and errors.
Article on the topic: Penester - instructions for use, dosage, composition, release form, indications and price
Brodmann field diagram:
Second signaling system
The second signaling system exists exclusively in Homo sapiens, its emergence is explained by speech abilities and thinking.
The second signaling system is located in the cores of the motor analyzer of written text, the speech motor analyzer, and the understanding of verbal and nonverbal speech. The nuclei of the second system are located in the posterior and central regions of the underlying frontal gyrus, as well as in the overlying temporal sulcus and the inferior parietal lobe.
The purpose of the second signaling system is determined by the cores.
The core of the perception of writing includes field 40, it is responsible for the image and understanding of written letters. It also controls hand movements, rotations of the skull and eyes, and fine motor skills.
The speech motor area consists of area 44 - this is Brocca's speech center, as well as 45, associated with musical perception. This nucleus is interconnected with areas of movement, since the motor skills of many muscles of the tongue and mouth play a role in the speech process. Performs the functions of oral reproduction of sounds, words and phrases.
The auditory nucleus of oral speech consists of areas 42 and 22 and controls the task of recognizing and understanding oral speech sounds.
The core of written speech, field 29, provides the functions of analysis, perception and understanding of written text and reading.
Source
Paul Brodmann
Brodmann's cytoarchitectonic fields
- these are numbered areas, from 1 to 50, representing the fields of the cerebral cortex, divided on the basis of cytoarchitecture or principles of cell organization. There are also maps of the cortex, built taking into account differences in the location of nerve fibers, that is, myeloarchitecture.
Notes
See what “Brodmann fields” are in other dictionaries:
Brodmann's cytoarchitectonic areas - Lateral surface of the brain with numbered Brodmann's areas ... Wikipedia
BRODMAN FIELD - [by German name. psychiatrist K. Brodmann (K. Brodmann, 1868 1918)] areas of the cerebral cortex, named after Brodmann, who described 52 fields that differ in size, shape, structure and location of nerve cells and... ... Psychomotor: dictionary- directory
BRODMAN'S FIELD - A map of the cerebral cortex created on the basis of the architectural organization of nerve cells. Each of the 44 Brodmann fields differs from the others in its histological characteristics. It should be noted that the fields identified by Brodman are not always... ... Dictionary of Psychology
Cytoarchitectonic Brodmann Areas are numbered areas (from 1 to 50), which are fields of the cerebral cortex identified by histological characteristics. There are also maps of the cortex constructed taking into account differences in the location of nerve fibers, i.e. myeloarchitectonics... ... Medical terms
MAP OF CYTOARCHITONIC FIELDS OF THE CEREBRAL CORTEX
Lateral surface of the brain with numbered Brodmann's areas. Central part of the brain with numbered Brodmann areas. Brodmann's areas
are sections of the cerebral cortex that differ in their cytoarchitectonics (structure at the cellular level). There are 52 Brodmann cytoarchitectonic areas.
In 1909, the German neurologist Korbinian Brodmann published[1] maps of the cytoarchitectonic fields of the cerebral cortex. Brodmann was the first to create maps of the cortex. Subsequently, O. Vogt and C. Vogt (1919-1920), taking into account the fiber structure, described 150 myeloarchitectonic areas in the cerebral cortex. At the Brain Institute of the USSR Academy of Medical Sciences (now the Scientific Center for Neurology of the Russian Academy of Medical Sciences) I.N. Filimonov and S.A. Sarkisov created maps of the cerebral cortex, including 47 cytoarchitectonic fields [2].
Despite criticism[3], Brodmann's fields are the best known and most often cited when describing the neuronal organization of the cerebral cortex and its functions.
The assignment of a particular area of the cortex to a specific field was based on a histological examination - Nissl staining. Certain fields correspond to areas of the brain responsible for certain functions.
A. W. Campbell proposed a division of fields into primary, secondary and tertiary. The primary and secondary fields (nuclear zone of the analyzer) receive impulses directly from the thalamus, while the tertiary fields receive impulses only from the primary and secondary fields. Primary fields produce a specific analysis of impulses of a certain modality. Secondary fields interact between different analyzer zones. Tertiary fields play a decisive role in complex types of mental activity - symbolic, speech, intellectual.[4]
Brain map
The new structural and functional map divides the cerebral cortex into 180 sections.
The cerebral cortex is extremely complex - its different parts differ from each other both in function and in cellular structure. Naturally, those who began to study the brain very soon needed a “terrain map” for the cerebral cortex, and the system of cytoarchitectonic fields, published by the German neurologist Korbinian Brodmann back in 1909, became a kind of gold standard here.
- 1
- 2
These fields differ in cell morphology and in the way the cells in them are stacked relative to each other (that is, in cellular cytoarchitecture). Brodmann fields turned out to be extremely useful, but still had some significant disadvantages.
Firstly, Brodmann himself built his map on the material of just one brain, taken from a deceased person. Subsequently, the structure of the cortical fields was clarified using more diverse material, and functions were added to the pure morphological parameters: what one area is responsible for, what another is responsible for, etc. However, the more neuroscientists learned about the brain, the clearer it became that the cerebral cortex needs to be re-mapped using several features simultaneously.
This work was undertaken by Matthew F. Glasser and his colleagues from Washington University in St. Louis, Oxford, the University of Minnesota and the University of Nijmegen. They took a set of magnetic resonance imaging (MRI) data accumulated as part of the Human Connectome project (recall that the goal of the Human Connectome project is to fully describe the structure of connections in our brain).
The researchers were interested in the results of structural MRI, which allows one to establish, for example, the thickness of certain areas of the cortex and other similar features, and functional MRI, with which one can see the function of one or another area of the brain. At the same time, the brain can rest during scanning, and then we will discern its basic functional topography, or it can perform some task - and then we will see which areas are working on a specific procedure. To construct a new cortical map, we used fMRI data obtained from seven tasks, ranging from audio tests to math problems.
Thus, the algorithm that searched for functional fields in the cortex had to operate with several parameters at once, structural and functional. As a result, it was possible to detect as many as 180 fields in each hemisphere, 83 of which had previously been described in the literature, but 97 turned out to be hitherto unknown.
The algorithm worked with the results of MRI scans of 210 volunteers of the Human Connectome project, and the question immediately arose: would it be possible to determine the same zones in other people? Wouldn't it turn out that a map of 180 fields makes sense only for those two hundred people on whom the above-mentioned algorithm was trained?
But when they tried to analyze a set of MRI data from “strangers”, their cortical zones were determined almost the same way. Moreover, the authors of the work were also able to determine individual differences between certain areas. (Just in case, let’s clarify that individual differences do not mean that one’s brain is structured one way and another’s – another, just that the zones can work with different efficiency and be less developed; similarly, if we see a tall person and a short person next to each other , we are not saying that they have a different structure plan.)
It is clear that the new map (described in the Nature article) will be useful in both basic science and medicine. True, it also has its drawbacks, related, first of all, to the fact that MRI still does not have a high enough spatial resolution, that is, the cerebral cortex can actually be divided into an even larger number of fields.
On the other hand, it remains to be seen how the new 180 zones are structured at the level of cells, synapses and their molecular characteristics. And finally, let's not forget about the recent work that called into question thousands and thousands of MRI scan results - let's hope that the new cortical map will not suffer too much from this revelation.
For the first time, a complete atlas of the human brain has been compiled with a cellular resolution of 1 micron/pixel
Several images from the Atlas of the Human Brain.
Image: Allen Institute for Brain Science Knowing the detailed anatomical structure of the human brain is critical to understanding its functionality. Existing reference atlases are not of high quality: they are relatively low resolution or incomplete, or lack structure annotations. For a long time, atlases of the human brain were inferior to atlases of the brains of worms, flies and mice in quality, spatial resolution and completeness. This is due to technical limitations due to the enormous size and complexity of the human brain. Needless to say, if atlases from a hundred years ago are still often used in medicine.
It’s good that there are still philanthropists in the world, such as Microsoft co-founder Paul Allen. Half a billion dollars invested in a scientific project to study the human brain has brought results. Scientists from the Allen Institute for Brain Science have filled a large scientific gap - and prepared the most comprehensive and detailed digital atlas of the human brain to date. It was compiled using neuroimaging, high-resolution histological examination and the chemoarchitecture of the brain of a 34-year-old woman (as is known, the female brain is structurally and functionally no different from the male).
To compile the atlas, it was necessary to use magnetic resonance imaging, diffusion-weighted imaging (diffusion MRI) and 1356 large anatomical plates the size of a cerebral hemisphere for immunohistochemistry (IHC) and Nissl studies at cellular resolution, that is, 1 μm/pixel.
Earlier this year, researchers at the Human Connectome Project announced the creation of an atlas of the human brain. They compiled MRI images from 210 adults. But this picture doesn't even come close to matching one woman's detailed atlas at the cellular level, compiled by the Allen Institute for Neuroscience.
“This is the most structurally comprehensive atlas to date, and we hope that it will serve as a reference reference for the human brain across a variety of scientific disciplines,” said Ed Lein, Ph.D., an Allen Institute postdoctoral fellow in neuroscience. In the future, this atlas will be useful as a basic reference for overlaying other maps of the human brain, including functional maps or maps of the cellular composition of brain regions. This is a kind of unified framework for integrating many scientific studies, combining different types of data about the human brain.
The most detailed map of neural connections in the human brain has been created
There are 86 billion neurons in the human brain, communicating with each other through hundreds of trillions of synapses. This is an intricate network of neural connections, in the depths of which our consciousness, thoughts, feelings, memories and individuality lurk.
The human brain is more complex than any computer that exists today. Therefore, visualizing the complete structure of all its connections seems, at first glance, a completely impossible task.
However, researchers around the world are hard at work, literally piecing together small areas of the human brain. By the way, such a map of neural connections is called a “connectome,” and the science that deals with “cartography” of the nervous system is connectomics.
In 2021, researchers from Google, in collaboration with colleagues from the Howard Hughes Medical Institute, created the fruit fly brain connectome. It sounds like a fairly simple task, but so far they have only been able to map about half of the insect's brain.
Recently, Google, together with researchers from Harvard, released a similar model of the human brain. More precisely, its tiny plot.
The researchers used a sample from the temporal lobe of the cerebral cortex measuring only 1 mm3 for this purpose. It was painted with special substances and cut into 5,300 layers about 30 nanometers thick. Each of these layers was then scanned using an electron microscope.
So scientists received 225 million two-dimensional images, which were then “stitched” into a 3D model.
Different cells and their structures within the sample were identified using machine learning algorithms. Researchers only occasionally manually checked the accuracy with which the machines determined the identity of different cells.
The end result is called the H01 dataset, and is one of the most comprehensive maps of the human brain ever created. It contains information about 50,000 nerve cells, 130 million synapses and, in addition, visualizes additional details: neuronal axons and dendrites, myelin and ciliated epithelial cells.
The most impressive thing about this data set is that it took up a whopping 1.4 petabytes of memory. This is more than a million gigabytes.
At the same time, Google claims that this is only one millionth of a complete map of the human brain.
It turns out that enormous complexity will be presented not only by the work of mapping this entire volume, but also by finding a place to store this incredible amount of information. In addition, researchers have yet to find a way to organize the data obtained and provide easy access to them.
In the meantime, the currently collected H01 dataset is available for review online.
The scientific paper accompanying this achievement was published on the preprint site bioRxiv.
Let us recall that we previously wrote about creating a brain map showing where individual words are “stored” in it (by the way, it is also available online). We also reported that scientists have discovered similarities between the human brain and a swarm of bees.
You will find more news from the world of science and technology in the “Science” section on the “We Watch” media platform.
Function and semiotics of lesion
Brodmann's 7th cytoarchitectonic area receives information from the primary somatosensory area, located in the postcentral gyrus and represented by fields 3, 1 and 2, as well as from the visual cortex of the occipital lobes. Thus, several analyzers overlap in this field. From the point of view of Penfield’s functional theory of the organization of the cerebral cortex, this Brodmann field is a tertiary projection field (an associative zone at the point where various analyzers overlap, in which the integration of various signals occurs, the formation of corresponding sensations, and the implementation of complex analytical and synthetic functions) [2]. In the 7th field, those areas are developed that are responsible for receiving information (layer IV) and transmitting it to other parts of the cortex (layer III - the axons of nerve cells of which form associative and commissural fibers)[3].
In the 5th and 7th fields, the analysis and processing of information received in the postcentral gyrus about both deep and superficial sensitivity occurs. These fields provide stereognosis - recognition of objects by touch.
Damage to the 5th and 7th cytoarchitectonic Brodmann areas is characterized by the occurrence of astereognosis
- impairment of the ability to recognize an object by touch. A person clearly defines the properties of an object: “hard” or “soft”, “cold” or “warm”, “smooth” or “embossed”, etc. At the same time, he loses the ability to analyze the information received and determine the object itself [4].
Also, with damage to Brodmann's cytoarchitectonic area 7 in the area of the right (non-dominant) hemisphere, autotopognosia occurs - a violation of recognition of one's own body and its parts. A patient with a violation of the body diagram may feel that his limbs are either enlarged (macropsia) or decreased (micropsia) in size, or changed not only in size, but also in shape (metamorphopsia). One of the variants of autotopognosia is agnosia of the fingers. Patients may confuse the right and left sides and claim that they have many arms or legs (polymelia). This group of disorders also includes anosognosia (Anton's syndrome), when the patient is not aware of the presence of a defect (motor, auditory, etc.) and/or disease. Anosognosia is often combined with autotopagnosia and occurs against the background of severe impairments of proprioceptive sensitivity [5].